Boxplots
Boxplots can be created for individual variables or for variables by group. The format is boxplot(x, data=), where x is a formula and data= denotes the data frame providing the data. An example of a formula is y~group where a separate boxplot for numeric variable y is generated for each value of group. Add varwidth=TRUE to make boxplot widths proportional to the square root of the samples sizes. Add horizontal=TRUE to reverse the axis orientation.
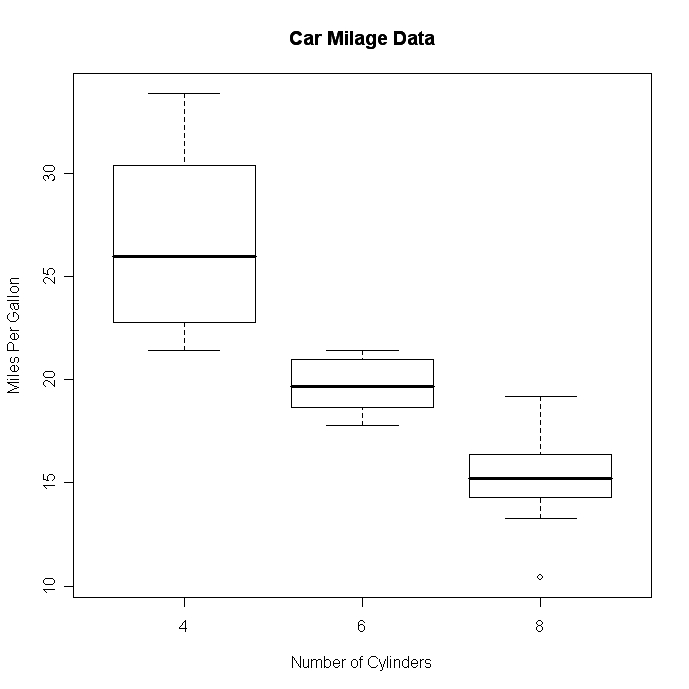
# Boxplot of MPG by Car Cylinders

boxplot(mpg~cyl,data=mtcars, main="Car Milage Data",
   xlab="Number of Cylinders", ylab="Miles Per Gallon")
 click to view
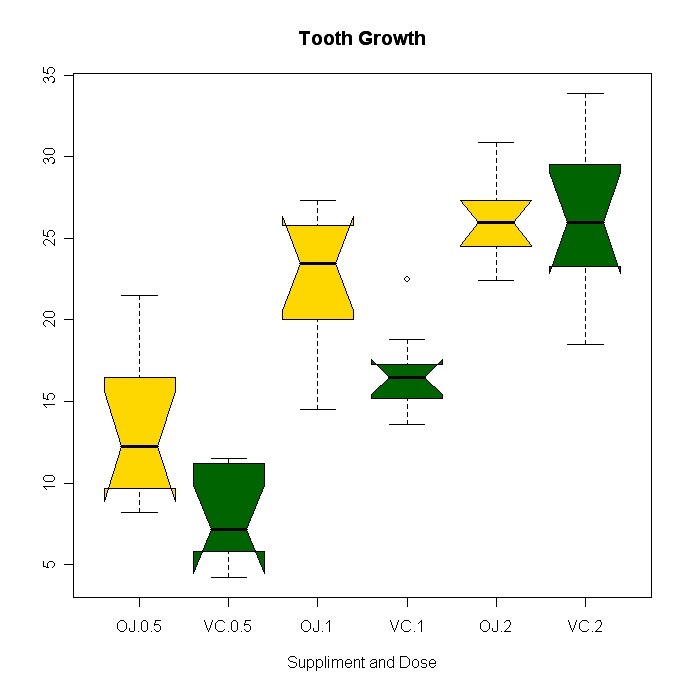
# Notched Boxplot of Tooth Growth Against 2 Crossed Factors
# boxes colored for ease of interpretation

boxplot(len~supp*dose, data=ToothGrowth, notch=TRUE,
  col=(c("gold","darkgreen")),
  main="Tooth Growth", xlab="Suppliment and Dose")
 click to view
In the notched boxplot , if two boxes' notches do not overlap this is ‘strong evidence’ their medians differ (Chambers et al., 1983, p. 62).
Colors recycle. In the example above, if I had listed 6 colors, each box would have its own color. Earl F. Glynn has created an easy to use list of colors is PDF format.
Other Options
The boxplot.matrix( ) function in the sfsmisc package draws a boxplot for each column (row) in a matrix. The boxplot.n( ) function in thegplots package annotates each boxplot with its sample size. The bplot( ) function in the Rlab package offers many more options controlling the positioning and labeling of boxes in the output.
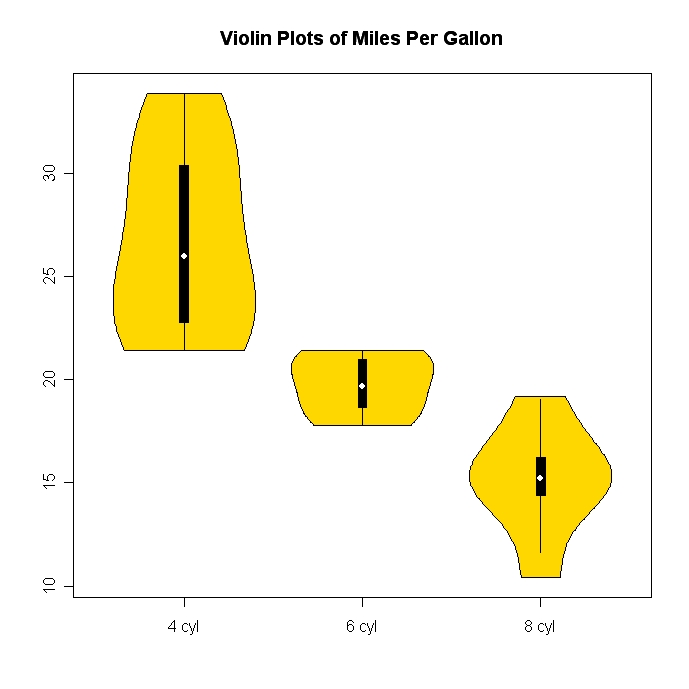
Violin Plots
A violin plot is a combination of a boxplot and a kernel density plot. They can be created using the vioplot( ) function from vioplot package.
# Violin Plots
library(vioplot)
x1 <- mtcars$mpg[mtcars$cyl==4]
x2 <- mtcars$mpg[mtcars$cyl==6]
x3 <- mtcars$mpg[mtcars$cyl==8]
vioplot(x1, x2, x3, names=c("4 cyl", "6 cyl", "8 cyl"),
   col="gold")
title("Violin Plots of Miles Per Gallon")
 click to view
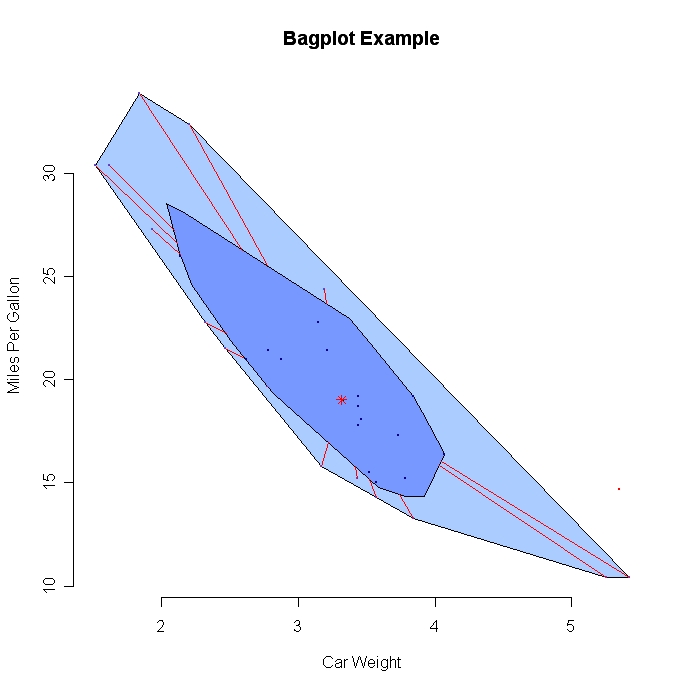
Bagplot - A 2D Boxplot Extension
The bagplot(x, y) function in the aplpackpackage provides a bivariate version of the univariate boxplot. The bag contains 50% of all points. The bivariate median is approximated. The fence separates points in the fence from points outside. Outliers are displayed.
# Example of a Bagplot
library(aplpack)
attach(mtcars)
bagplot(wt,mpg, xlab="Car Weight", ylab="Miles Per Gallon",
  main="Bagplot Example")
 click to view
To Practice
Try the boxplot exercises in this course on plotting and data visualization in R.