Bar Plots
Create barplots with the barplot(height) function, where height is a vector or matrix. If height is a vector , the values determine the heights of the bars in the plot. If height is a matrix and the option beside=FALSE then each bar of the plot corresponds to a column of height, with the values in the column giving the heights of stacked “sub-bars”. If height is a matrix and beside=TRUE , then the values in each column are juxtaposed rather than stacked. Include option names.arg=(character vector) to label the bars. The option horiz=TRUE to createa a horizontal barplot.
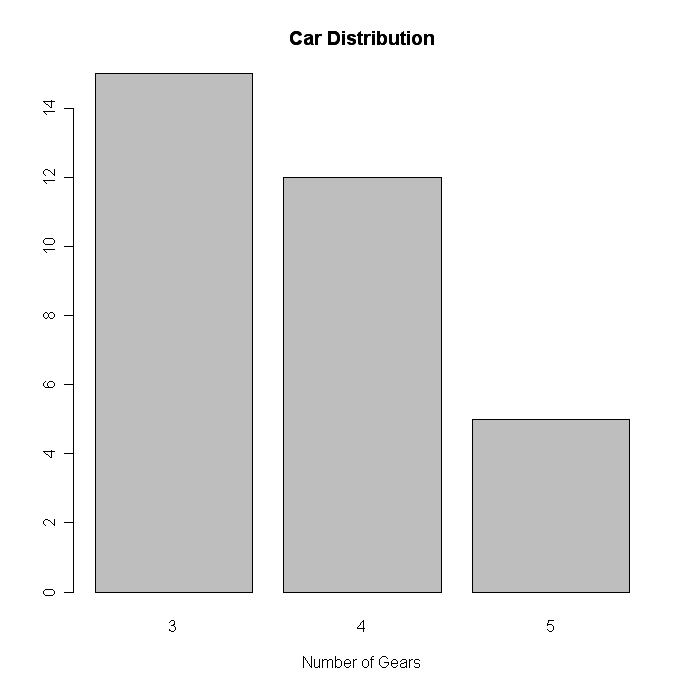
Simple Bar Plot
# Simple Bar Plot
counts <- table(mtcars$gear)
barplot(counts, main="Car Distribution",
   xlab="Number of Gears")
 click to view
# Simple Horizontal Bar Plot with Added Labels
counts <- table(mtcars$gear)
barplot(counts, main="Car Distribution", horiz=TRUE,
  names.arg=c("3 Gears", "4 Gears", "5 Gears"))
 click to view
Stacked Bar Plot
# Stacked Bar Plot with Colors and Legend
counts <- table(mtcars$vs, mtcars$gear)
barplot(counts, main="Car Distribution by Gears and VS",
  xlab="Number of Gears", col=c("darkblue","red"),
  legend = rownames(counts))
 click to view
Grouped Bar Plot
# Grouped Bar Plot
counts <- table(mtcars$vs, mtcars$gear)
barplot(counts, main="Car Distribution by Gears and VS",
  xlab="Number of Gears", col=c("darkblue","red"),
  legend = rownames(counts), beside=TRUE)
 click to view
Notes
Bar plots need not be based on counts or frequencies. You can create bar plots that represent means, medians, standard deviations, etc. Use the aggregate( )function and pass the results to the barplot( ) function.
By default, the categorical axis line is suppressed. Include the option axis.lty=1 to draw it.
With many bars, bar labels may start to overlap. You can decrease the font size using the cex.names = option. Values smaller than one will shrink the size of the label. Additionally, you can use graphical parameters such as the following to help text spacing:
# Fitting Labels
par(las=2) # make label text perpendicular to axis
par(mar=c(5,8,4,2)) # increase y-axis margin.

counts <- table(mtcars$gear)
barplot(counts, main="Car Distribution", horiz=TRUE, names.arg=c("3 Gears", "4 Gears", "5   Gears"), cex.names=0.8)
 click to view