Graphical Parameters
You can customize many features of your graphs (fonts, colors, axes, titles) through graphic options.
One way is to specify these options in through the par( ) function. If you set parameter values here, the changes will be in effect for the rest of the session or until you change them again. The format is par(optionname=value , optionname= value ,...)
# Set a graphical parameter using par()

par()              # view current settings
opar <- par()      # make a copy of current settings
par(col.lab="red") # red x and y labels
hist(mtcars$mpg)   # create a plot with these new settings
par(opar)          # restore original settings
A second way to specify graphical parameters is by providing the _ optionname _=value pairs directly to a high level plotting function. In this case, the options are only in effect for that specific graph.
# Set a graphical parameter within the plotting function
hist(mtcars$mpg, col.lab="red")
See the help for a specific high level plotting function (e.g. plot, hist, boxplot) to determine which graphical parameters can be set this way.
The remainder of this section describes some of the more important graphical parameters that you can set.
Text and Symbol Size
The following options can be used to control text and symbol size in graphs.
| option | description |
| cex | number indicating the amount by which plotting text and symbols should be scaled relative to the default. 1=default, 1.5 is 50% larger, 0.5 is 50% smaller, etc. |
| cex.axis | magnification of axis annotation relative to cex |
| cex.lab | magnification of x and y labels relative to cex |
| cex.main | magnification of titles relative to cex |
| cex.sub | magnification of subtitles relative to cex |
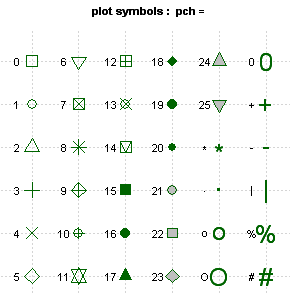
Plotting Symbols
Use the pch= option to specify symbols to use when plotting points. For symbols 21 through 25, specify border color (col=) and fill color (bg=).
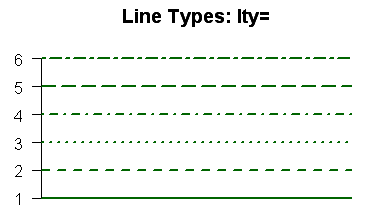
Lines
You can change lines using the following options. This is particularly useful for reference lines, axes, and fit lines.
| option | description |
| lty | line type. see the chart below. |
| lwd | line width relative to the default (default=1). 2 is twice as wide. |
Colors
Options that specify colors include the following.
| option | description |
| col | Default plotting color. Some functions (e.g. lines) accept a vector of values that are recycled. |
| col.axis | color for axis annotation |
| col.lab | color for x and y labels |
| col.main | color for titles |
| col.sub | color for subtitles |
| fg | plot foreground color (axes, boxes - also sets col= to same) |
| bg | plot background color |
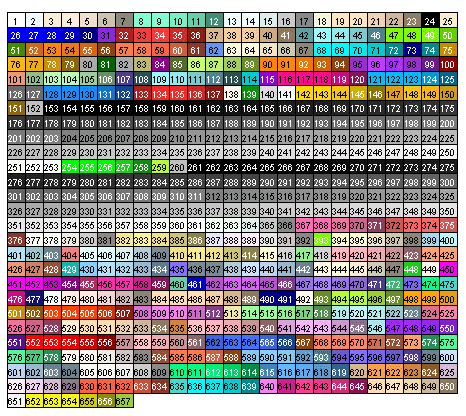
You can specify colors in R by index, name, hexadecimal, or RGB.
For example col=1 , col="white" , and col="#FFFFFF" are equivalent.
The following chart was produced with code developed by Earl F. Glynn. See his Color Chart for all the details you would ever need about using colors in R.
You can also create a vector of n contiguous colors using the functions rainbow(n), heat.colors(n), terrain.colors(n), topo.colors(n), and cm.colors(n).
colors() returns all available color names.
Fonts
You can easily set font size and style, but font family is a bit more complicated.
| option | description |
| font | Integer specifying font to use for text. |
| 1=plain, 2=bold, 3=italic, 4=bold italic, 5=symbol | |
| font.axis | font for axis annotation |
| font.lab | font for x and y labels |
| font.main | font for titles |
| font.sub | font for subtitles |
| ps | font point size (roughly 1/72 inch) |
| text size=ps*cex | |
| family | font family for drawing text. Standard values are "serif", "sans", "mono", "symbol". Mapping is device dependent. |
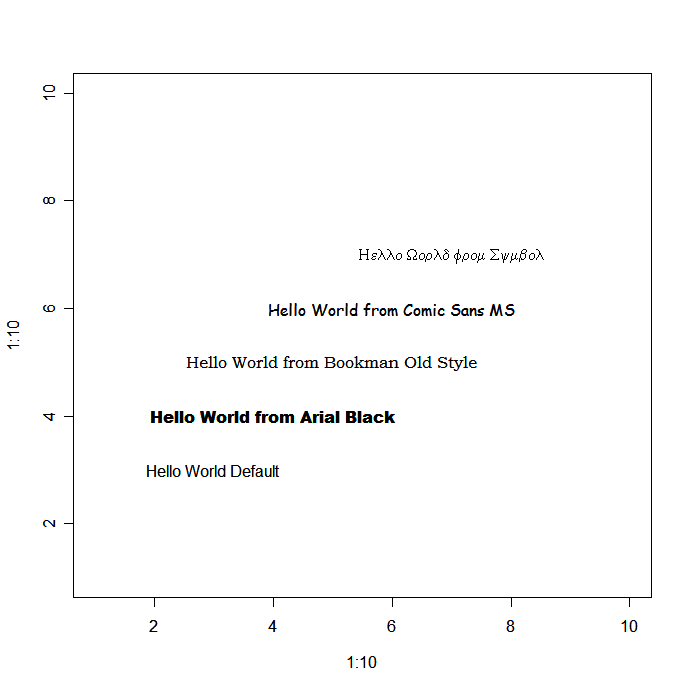
In windows, mono is mapped to "TT Courier New", serif is mapped to"TT Times New Roman", sans is mapped to "TT Arial", mono is mapped to "TT Courier New", and symbol is mapped to "TT Symbol" (TT=True Type). You can add your own mappings.
# Type family examples - creating new mappings
plot(1:10,1:10,type="n")
windowsFonts(
  A=windowsFont("Arial Black"),
  B=windowsFont("Bookman Old Style"),
  C=windowsFont("Comic Sans MS"),
  D=windowsFont("Symbol")
)
text(3,3,"Hello World Default")
text(4,4,family="A","Hello World from Arial Black")
text(5,5,family="B","Hello World from Bookman Old Style")
text(6,6,family="C","Hello World from Comic Sans MS")
text(7,7,family="D", "Hello World from Symbol")
 click to view
Margins and Graph Size
You can control the margin size using the following parameters.
| option | description |
| mar | numerical vector indicating margin size c(bottom, left, top, right) in lines. default = c(5, 4, 4, 2) + 0.1 |
| mai | numerical vector indicating margin size c(bottom, left, top, right) in inches |
| pin | plot dimensions (width, height) in inches |
For complete information on margins, see Earl F. Glynn's margin tutorial.
Going Further
See help(par) for more information on graphical parameters. The customization of plotting axes and text annotations are covered next section.