Histograms and Density Plots
Histograms
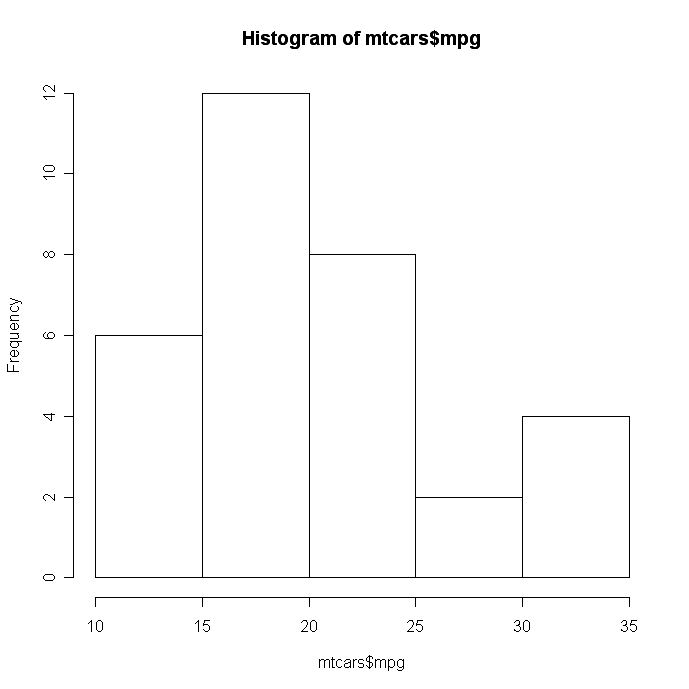
You can create histograms with the function hist(x) where x is a numeric vector of values to be plotted. The option freq=FALSE plots probability densities instead of frequencies. The option breaks= controls the number of bins.
# Simple Histogram
hist(mtcars$mpg)
 click to view
# Colored Histogram with Different Number of Bins
hist(mtcars$mpg, breaks=12, col="red")
 click to view
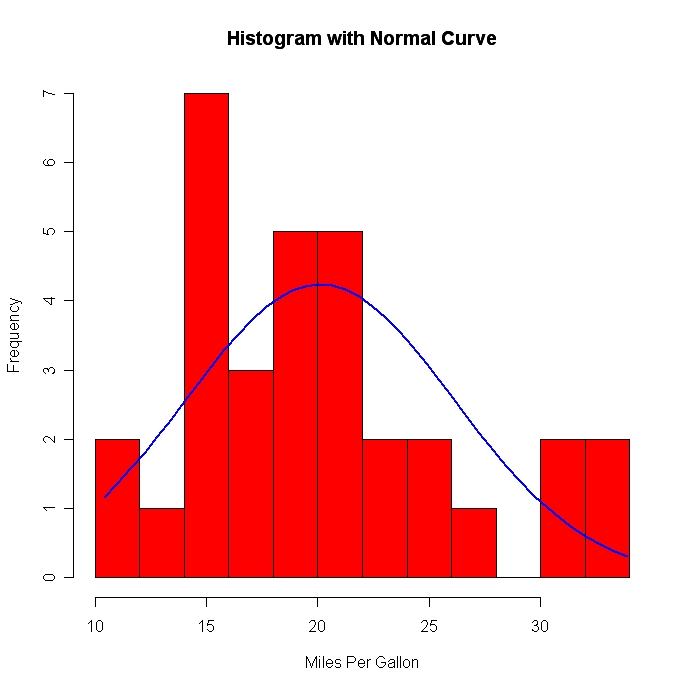
# Add a Normal Curve (Thanks to Peter Dalgaard)
x <- mtcars$mpg
h<-hist(x, breaks=10, col="red", xlab="Miles Per Gallon",
   main="Histogram with Normal Curve")
xfit<-seq(min(x),max(x),length=40)
yfit<-dnorm(xfit,mean=mean(x),sd=sd(x))
yfit <- yfit*diff(h$mids[1:2])*length(x)

lines(xfit, yfit, col="blue", lwd=2)
 click to view
Histograms can be a poor method for determining the shape of a distribution because it is so strongly affected by the number of bins used.
Kernel Density Plots
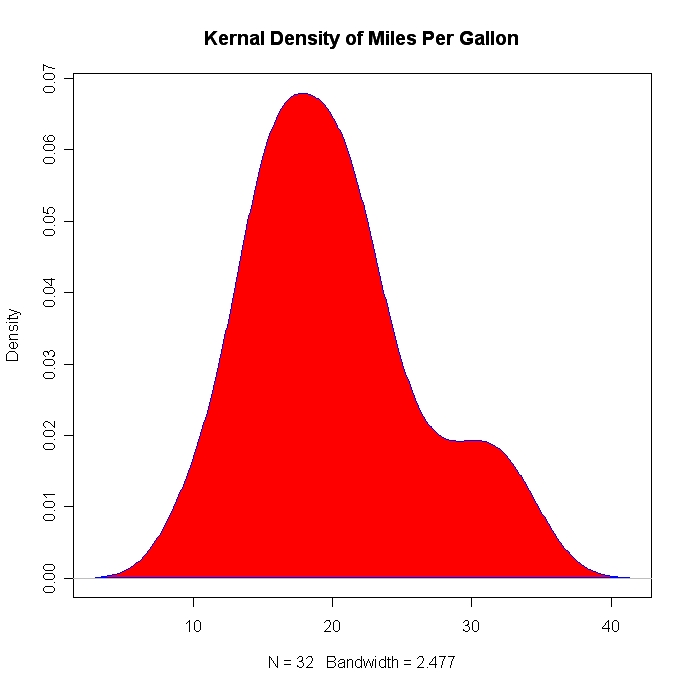
Kernal density plots are usually a much more effective way to view the distribution of a variable. Create the plot using plot(density(x)) where x is a numeric vector.
# Kernel Density Plot
d <- density(mtcars$mpg) # returns the density data
plot(d) # plots the results
 click to view
# Filled Density Plot
d <- density(mtcars$mpg)
plot(d, main="Kernel Density of Miles Per Gallon")
polygon(d, col="red", border="blue")
 click to view
Comparing Groups VIA Kernal Density
The sm.density.compare( ) function in the sm package allows you to superimpose the kernal density plots of two or more groups. The format is sm.density.compare(x , factor) where x is a numeric vector and factor is the grouping variable.
# Compare MPG distributions for cars with
#
4,6, or 8 cylinders
library(sm)
attach(mtcars)

# create value labels
cyl.f <- factor(cyl, levels= c(4,6,8),
  labels = c("4 cylinder", "6 cylinder", "8 cylinder"))

# plot densities
sm.density.compare(mpg, cyl, xlab="Miles Per Gallon")
title(main="MPG Distribution by Car Cylinders")

# add legend via mouse click
colfill<-c(2:(2+length(levels(cyl.f))))
legend(locator(1), levels(cyl.f), fill=colfill)
 click to view