Multiple (Linear) Regression
R provides comprehensive support for multiple linear regression. The topics below are provided in order of increasing complexity.
Fitting the Model
# Multiple Linear Regression Example

fit <- lm(y ~ x1 + x2 + x3, data=mydata)
summary(fit) # show results
# Other useful functions
coefficients(fit) # model coefficients
confint(fit, level=0.95) # CIs for model parameters

fitted(fit) # predicted values
residuals(fit) # residuals
anova(fit) # anova table
vcov(fit) # covariance matrix for model parameters
influence(fit) # regression diagnostics
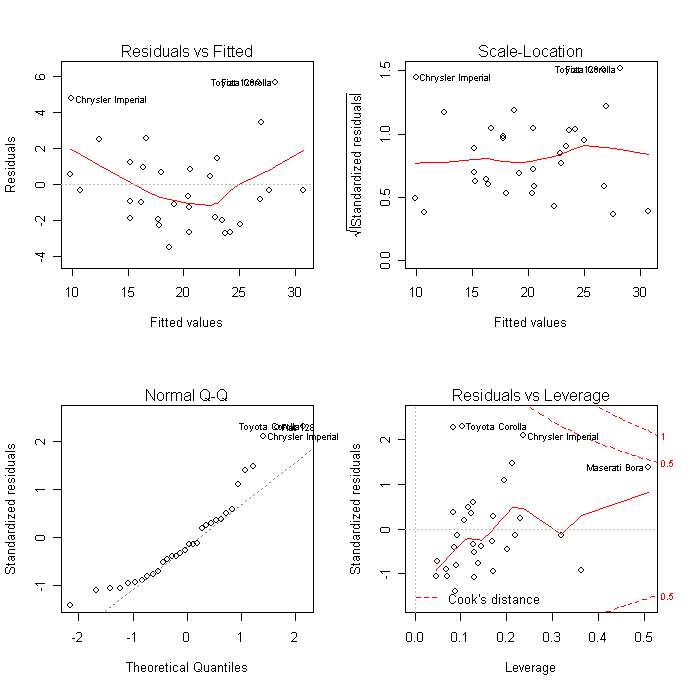
Diagnostic Plots
Diagnostic plots provide checks for heteroscedasticity, normality, and influential observerations.
# diagnostic plots
layout(matrix(c(1,2,3,4),2,2)) # optional 4 graphs/page
plot(fit)
 click to view
For a more comprehensive evaluation of model fit see regression diagnostics or the exercises in this interactive course on Supervised Learning in R: Regression.
Comparing Models
You can compare nested models with the anova( ) function. The following code provides a simultaneous test that x3 and x4 add to linear prediction above and beyond x1 and x2.
# compare models
fit1 <- lm(y ~ x1 + x2 + x3 + x4, data=mydata)
fit2 <- lm(y ~ x1 + x2)
anova(fit1, fit2)
Cross Validation
You can doK-Fold cross-validationusing the cv.lm( ) function in the DAAG package.
# K-fold cross-validation
library(DAAG)
cv.lm(df=mydata, fit, m=3) # 3 fold cross-validation
Sum the MSE for each fold, divide by the number of observations, and take the square root to get the cross-validated standard error of estimate.
You can assess R2 shrinkage via K-fold cross-validation. Using the crossval() function from the bootstrap package, do the following:
# Assessing R2 shrinkage using 10-Fold Cross-Validation

fit <- lm(y~x1+x2+x3,data=mydata)

library(bootstrap)
# define functions
theta.fit <- function(x,y){lsfit(x,y)}
theta.predict <- function(fit,x){cbind(1,x)%*%fit$coef}

# matrix of predictors
X
<- as.matrix(mydata[c("x1","x2","x3")])
# vector of predicted values
y <- as.matrix(mydata[c("y")])

results <- crossval(X,y,theta.fit,theta.predict,ngroup=10)
cor(y, fit$fitted.values)**2 # raw R2
cor(y,results$cv.fit)**2 # cross-validated R2
Variable Selection
Selecting a subset of predictor variables from a larger set (e.g., stepwise selection) is a controversial topic. You can perform stepwise selection (forward, backward, both) using the stepAIC( ) function from the MASS package. stepAIC( ) performs stepwise model selection by exact AIC.
# Stepwise Regression
library(MASS)
fit <- lm(y~x1+x2+x3,data=mydata)
step <- stepAIC(fit, direction="both")
step$anova # display results
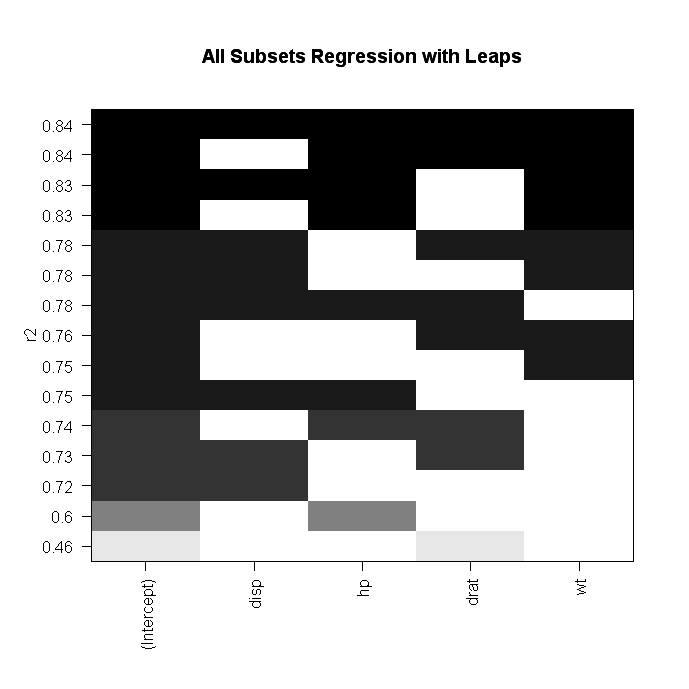
Alternatively, you can perform all-subsets regression using the leaps( ) function from the leaps package. In the following code nbest indicates the number of subsets of each size to report. Here, the ten best models will be reported for each subset size (1 predictor, 2 predictors, etc.).
# All Subsets Regression
library(leaps)
attach(mydata)
leaps<-regsubsets(y~x1+x2+x3+x4,data=mydata,nbest=10)
# view results
summary(leaps)
# plot a table of models showing variables in each model.
#
models are ordered by the selection statistic.
plot(leaps,scale="r2")
# plot statistic by subset size
library(car)
subsets(leaps, statistic="rsq")
 click to view
Other options for plot( ) are bic, Cp, and adjr2. Other options for plotting with
subset( ) are bic, cp, adjr2, and rss.
Relative Importance
The relaimpo package provides measures of relative importance for each of the predictors in the model. See help(calc.relimp) for details on the four measures of relative importance provided.
# Calculate Relative Importance for Each Predictor
library(relaimpo)
calc.relimp(fit,type=c("lmg","last","first","pratt"),
   rela=TRUE)

# Bootstrap Measures of Relative Importance (1000 samples)
boot <- boot.relimp(fit, b = 1000, type = c("lmg",
  "last", "first", "pratt"), rank = TRUE,
  diff = TRUE, rela = TRUE)
booteval.relimp(boot) # print result
plot(booteval.relimp(boot,sort=TRUE)) # plot result
 click to view
Graphic Enhancements
The car package offers a wide variety of plots for regression, including added variable plots, and enhanced diagnostic and Scatterplots.
Going Further
Nonlinear Regression
The nls package provides functions for nonlinear regression. See John Fox's Nonlinear Regression and Nonlinear Least Squares for an overview. Huet and colleagues' Statistical Tools for Nonlinear Regression: A Practical Guide with S-PLUS and R Examples is a valuable reference book.
Robust Regression
There are many functions in R to aid with robust regression. For example, you can perform robust regression with the rlm( ) function in the MASS package. John Fox's (who else?) Robust Regression provides a good starting overview. The UCLA Statistical Computing website has Robust Regression Examples.
The robust package provides a comprehensive library of robust methods, including regression. The robustbase package also provides basic robust statistics including model selection methods. And David Olive has provided an detailed online review of Applied Robust Statistics with sample R code.
To Practice
This course in machine learning in R includes excercises in multiple regression and cross validation.