Multidimensional Scaling
R provides functions for both classical and nonmetric multidimensional scaling. Assume that we have N objects measured on p numeric variables. We want to represent the distances among the objects in a parsimonious (and visual) way (i.e., a lower k-dimensional space).
Classical MDS
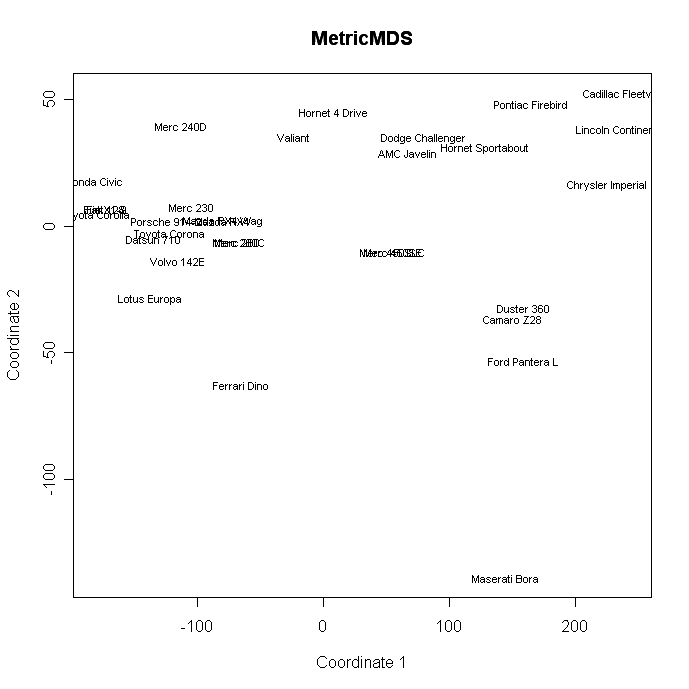
You can perform a classical MDS using the cmdscale( ) function.
# Classical MDS
# N rows (objects) x p columns (variables)
# each row identified by a unique row name

d <- dist(mydata) # euclidean distances between the rows
fit <- cmdscale(d,eig=TRUE, k=2) # k is the number of dim
fit # view results

# plot solution
x <- fit$points[,1]
y <- fit$points[,2]
plot(x, y, xlab="Coordinate 1", ylab="Coordinate 2",
  main="Metric MDS", type="n")
text(x, y, labels = row.names(mydata), cex=.7)
 click to view
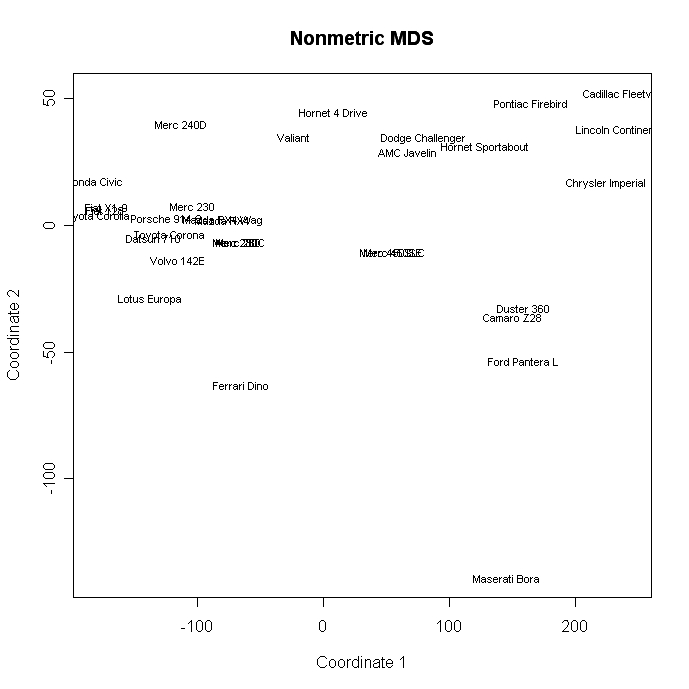
Nonmetric MDS
Nonmetric MDS is performed using the isoMDS( ) function in the MASS package.
# Nonmetric MDS
# N rows (objects) x p columns (variables)
# each row identified by a unique row name

library(MASS)
d <- dist(mydata) # euclidean distances between the rows
fit <- isoMDS(d, k=2) # k is the number of dim
fit # view results

# plot solution
x <- fit$points[,1]
y <- fit$points[,2]
plot(x, y, xlab="Coordinate 1", ylab="Coordinate 2",
  main="Nonmetric MDS", type="n")
text(x, y, labels = row.names(mydata), cex=.7)
 click to view
Individual Difference Scaling
3-way or individual difference scaling can be completed using the indscal() function in the SensoMineR package. The smacof package offers a three way analysis of individual differences based on stress minimization of means of majorization.
To Practice
This tutorial on ggplot2 includes exercises on Distance matrices and Multi-Dimensional Scaling (MDS).