Correspondence Analysis
Correspondence analysis provides a graphic method of exploring the relationship between variables in a contingency table. There are many options for correspondence analysis in R. I recommend the ca package by Nenadic and Greenacre because it supports supplimentary points, subset analyses, and comprehensive graphics. You can obtain the package here.
Although ca can perform multiple correspondence analysis (more than two categorical variables), only simple correspondence analysis is covered here. See their article for details on multiple CA.
Simple Correspondence Analysis
In the following example, A and B are categorical factors.
# Correspondence Analysis
library(ca)
mytable <- with(mydata, table(A,B)) # create a 2 way table
prop.table(mytable, 1) # row percentages
prop.table(mytable, 2) # column percentages
fit <- ca(mytable)
print(fit) # basic results
summary(fit) # extended results
plot(fit) # symmetric map
plot(fit, mass = TRUE, contrib = "absolute", map =
   "rowgreen", arrows = c(FALSE, TRUE)) # asymmetric map
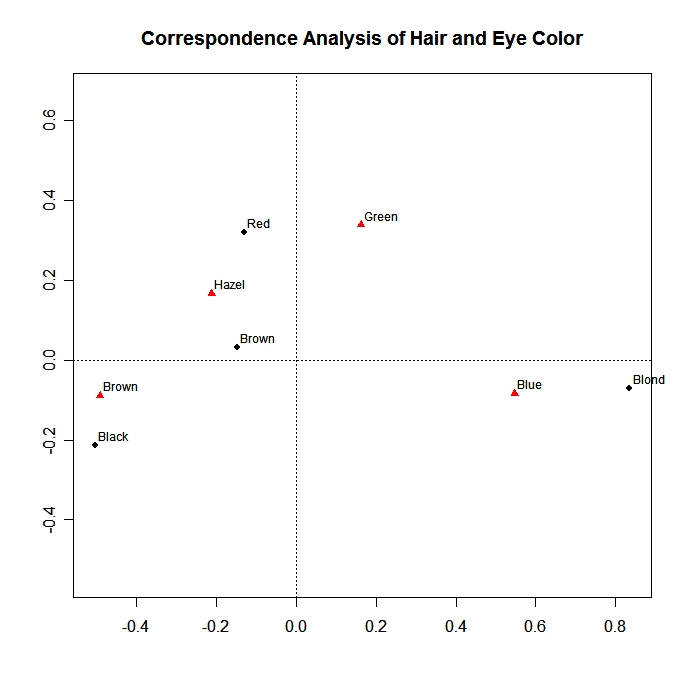
The first graph is the standard symmetric representation of a simple correspondence analysis with rows and column represented by points.
 click to view
Row points (column points) that are closer together have more similar column profiles (row profiles). Keep in mind that you can not interpret the distance between row and column points directly.
The second graph is asymmetric , with rows in the principal coordinates and columns in reconstructions of the standarized residuals. Additionally, mass is represented by points and columns are represented by arrows. Point intensity (shading) corresponds to the absolute contributions for the rows. This example is included to highlight some of the available options.
 click to view