Principal Components and Factor Analysis
This section covers principal components and factor analysis. The latter includes both exploratory and confirmatory methods.
Principal Components
The princomp( ) function produces an unrotated principal component analysis.
# Pricipal Components Analysis
# entering raw data and extracting PCs
#
from the correlation matrix
fit <- princomp(mydata, cor=TRUE)
summary(fit) # print variance accounted for
loadings(fit) # pc loadings
plot(fit,type="lines") # scree plot
fit$scores # the principal components
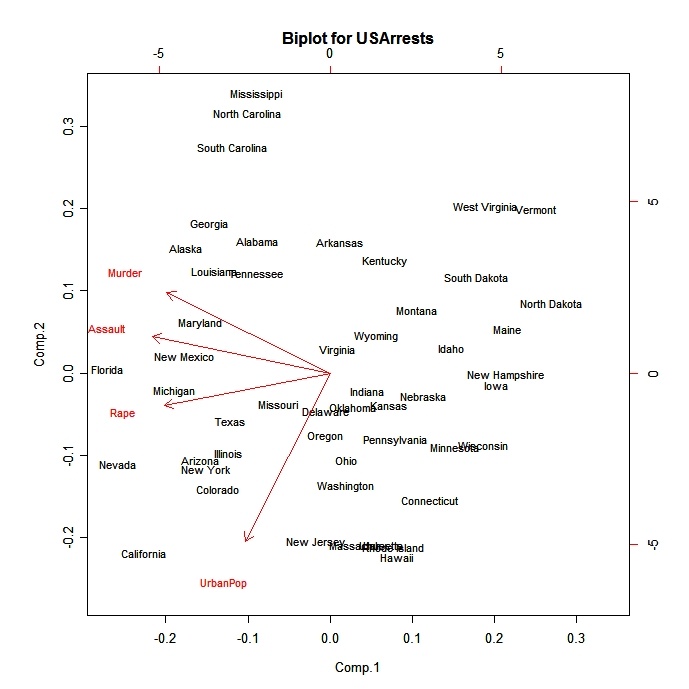
biplot(fit)

 click to view
Use cor=FALSE to base the principal components on the covariance matrix. Use the covmat= option to enter a correlation or covariance matrix directly. If entering a covariance matrix, include the option n.obs=.
The principal( ) function in the psych package can be used to extract and rotate principal components.
# Varimax Rotated Principal Components
# retaining 5 components
library(psych)
fit <- principal(mydata, nfactors=5, rotate="varimax")
fit # print results
mydata can be a raw data matrix or a covariance matrix. Pairwise deletion of missing data is used. rotate can "none", "varimax", "quatimax", "promax", "oblimin", "simplimax", or "cluster"
Exploratory Factor Analysis
The factanal( ) function produces maximum likelihood factor analysis.
# Maximum Likelihood Factor Analysis
# entering raw data and extracting 3 factors,
#
with varimax rotation

fit <- factanal(mydata, 3, rotation="varimax")
print(fit, digits=2, cutoff=.3, sort=TRUE)
# plot factor 1 by factor 2
load <- fit$loadings[,1:2]
plot(load,type="n") # set up plot
text(load,labels=names(mydata),cex=.7) # add variable names
 click to view
The rotation= options include "varimax", "promax", and "none". Add the option scores="regression" or "Bartlett" to produce factor scores. Use the covmat= option to enter a correlation or covariance matrix directly. If entering a covariance matrix, include the option n.obs=.
The factor.pa( ) function in the psych package offers a number of factor analysis related functions, including principal axis factoring.
# Principal Axis Factor Analysis
library(psych)
fit <- factor.pa(mydata, nfactors=3, rotation="varimax")
fit # print results
mydata can be a raw data matrix or a covariance matrix. Pairwise deletion of missing data is used. Rotation can be "varimax" or "promax".
Determining the Number of Factors to Extract
A crucial decision in exploratory factor analysis is how many factors to extract. ThenFactors package offer a suite of functions to aid in this decision. Details on this methodology can be found in a PowerPoint presentation by Raiche, Riopel, and Blais. Of course, any factor solution must be interpretable to be useful.
# Determine Number of Factors to Extract
library(nFactors)
ev <- eigen(cor(mydata)) # get eigenvalues
ap <- parallel(subject=nrow(mydata),var=ncol(mydata),
  rep=100,cent=.05)
nS <- nScree(x=ev$values, aparallel=ap$eigen$qevpea)
plotnScree(nS)
 click to view
Going Further
TheFactoMineR package offers a large number of additional functions for exploratory factor analysis. This includes the use of both quantitative and qualitative variables, as well as the inclusion of supplimentary variables and observations. Here is an example of the types of graphs that you can create with this package.
# PCA Variable Factor Map
library(FactoMineR)
result <- PCA(mydata) # graphs generated automatically

 click to view
Thye GPARotation package offers a wealth of rotation options beyond varimax and promax.
Structual Equation Modeling
Confirmatory Factor Analysis (CFA) is a subset of the much wider Structural Equation Modeling (SEM) methodology. SEM is provided in R via the sem package. Models are entered via RAM specification (similar to PROC CALIS in SAS). While sem is a comprehensive package, my recommendation is that if you are doing significant SEM work, you spring for a copy of AMOS. It can be much more user-friendly and creates more attractive and publication ready output. Having said that, here is a CFA example using sem.
Assume that we have six observered variables (X1, X2, ..., X6). We hypothesize that there are two unobserved latent factors (F1, F2) that underly the observed variables as described in this diagram. X1, X2, and X3 load on F1 (with loadings lam1, lam2, and lam3). X4, X5, and X6 load on F2 (with loadings lam4, lam5, and lam6). The double headed arrow indicates the covariance between the two latent factors (F1F2). e1 thru e6 represent the residual variances (variance in the observed variables not accounted for by the two latent factors). We set the variances of F1 and F2 equal to one so that the parameters will have a scale. This will result in F1F2 representing the correlation between the two latent factors.
For sem , we need the covariance matrix of the observed variables - thus the cov( ) statement in the code below. The CFA model is specified using the specify.model( ) function. The format is arrow specification, parameter name, start value. Choosing a start value of NA tells the program to choose a start value rather than supplying one yourself. Note that the variance of F1 and F2 are fixed at 1 (NA in the second column). The blank line is required to end the RAM specification.
# Simple CFA Model
library(sem)
mydata.cov <- cov(mydata)
model.mydata <- specify.model()
F1 ->  X1, lam1, NA
F1 ->  X2, lam2, NA
F1 ->  X3, lam3, NA
F2 ->  X4, lam4, NA
F2 ->  X5, lam5, NA
F2 ->  X6, lam6, NA
X1 <-> X1, e1,   NA
X2 <-> X2, e2,   NA
X3 <-> X3, e3,   NA
X4 <-> X4, e4,   NA
X5 <-> X5, e5,   NA
X6 <-> X6, e6,   NA
F1 <-> F1, NA,    1
F2 <-> F2, NA,    1
F1 <-> F2, F1F2, NA

mydata.sem <- sem(model.mydata, mydata.cov, nrow(mydata))
# print results (fit indices, paramters, hypothesis tests)
summary(mydata.sem)
# print standardized coefficients (loadings)

std.coef(mydata.sem)
You can use the boot.sem( ) function to bootstrap the structual equation model. See help(boot.sem) for details. Additionally, the function mod.indices( ) will produce modification indices. Using modification indices to improve model fit by respecifying the parameters moves you from a confirmatory to an exploratory analysis.
For more information on sem , see Structural Equation Modeling with the sem Package in R, by John Fox.
To Practice
To practice improving predictions, try the the Supervised Learning in R course