Cluster Analysis
R offers a wide range of functions for cluster analysis, including hierarchical agglomerative, partitioning, and model-based approaches. Although there is no definitive solution for determining the optimal number of clusters to extract, several approaches are available.
Data Preparation
Prior to clustering data, you may want to remove or estimate missing data and rescale variables for comparability.
# Prepare Data
mydata <- na.omit(mydata) # listwise deletion of missing
mydata <- scale(mydata) # standardize variables
Partitioning
K-means clustering is the most popular partitioning method. It requires the analyst to specify the number of clusters to extract. A plot of the within groups sum of squares by number of clusters extracted can help determine the appropriate number of clusters. The analyst looks for a bend in the plot similar to a scree test in factor analysis. See Everitt & Hothorn (pg. 251).
# Determine number of clusters
wss <- (nrow(mydata)-1)*sum(apply(mydata,2,var))
for (i in 2:15) wss[i] <- sum(kmeans(mydata,
   centers=i)$withinss)
plot(1:15, wss, type="b", xlab="Number of Clusters",
  ylab="Within groups sum of squares")
# K-Means Cluster Analysis
fit <- kmeans(mydata, 5) # 5 cluster solution
# get cluster means
aggregate(mydata,by=list(fit$cluster),FUN=mean)
# append cluster assignment
mydata <- data.frame(mydata, fit$cluster)
A robust version of K-means based on mediods can be invoked by using pam( ) instead of kmeans( ). The function pamk( ) in the fpc package is a wrapper for pam that also prints the suggested number of clusters based on optimum average silhouette width.
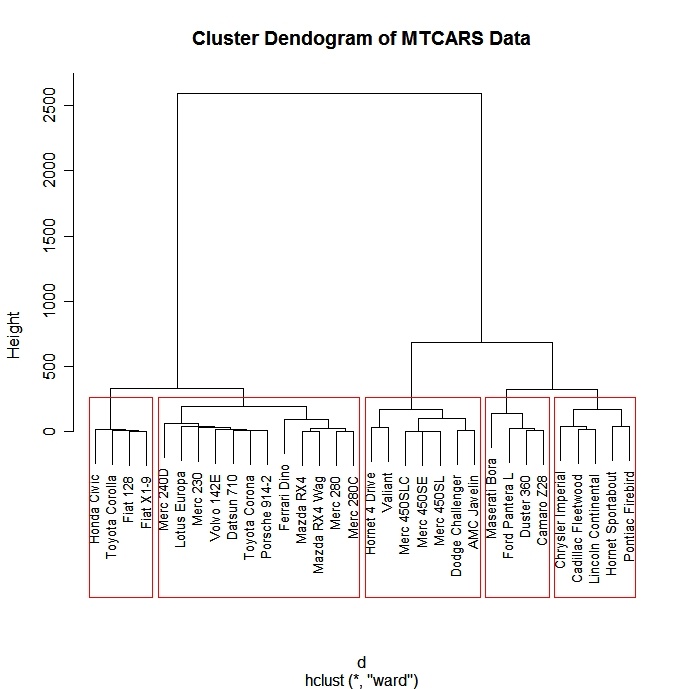
Hierarchical Agglomerative
There are a wide range of hierarchical clustering approaches. I have had good luck with Ward's method described below.
# Ward Hierarchical Clustering
d <- dist(mydata,
method = "euclidean") # distance matrix
fit <- hclust(d, method="ward")

plot(fit) # display dendogram
groups <- cutree(fit, k=5) # cut tree into 5 clusters
# draw dendogram with red borders around the 5 clusters
rect.hclust(fit, k=5, border="red")
 click to view
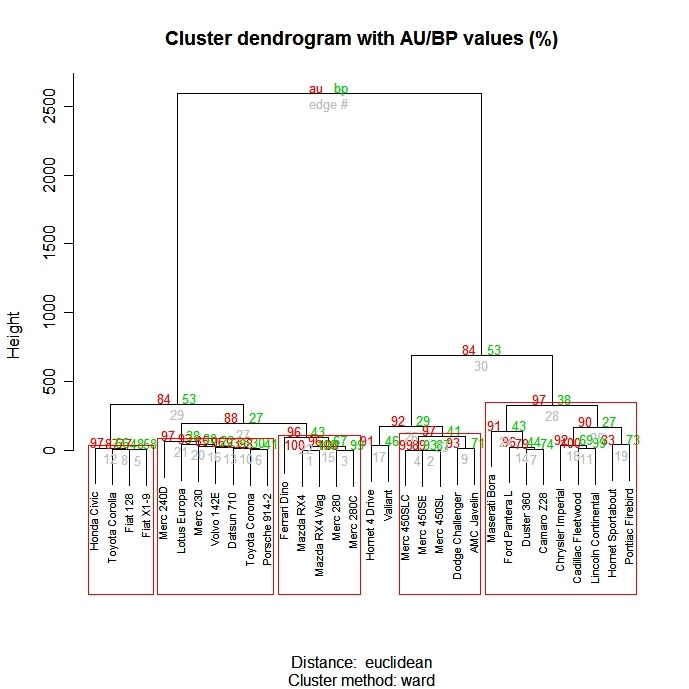
The pvclust( ) function in the pvclust package provides p-values for hierarchical clustering based on multiscale bootstrap resampling. Clusters that are highly supported by the data will have large p values. Be aware that pvclust clusters columns, not rows. Transpose your data before using.
# Ward Hierarchical Clustering with Bootstrapped p values
library(pvclust)
fit <-
pvclust(mydata, method.hclust="ward",
   method.dist="euclidean")
plot(fit) # dendogram with p values
# add rectangles around groups highly supported by the data
pvrect(fit, alpha=.95)
 click to view
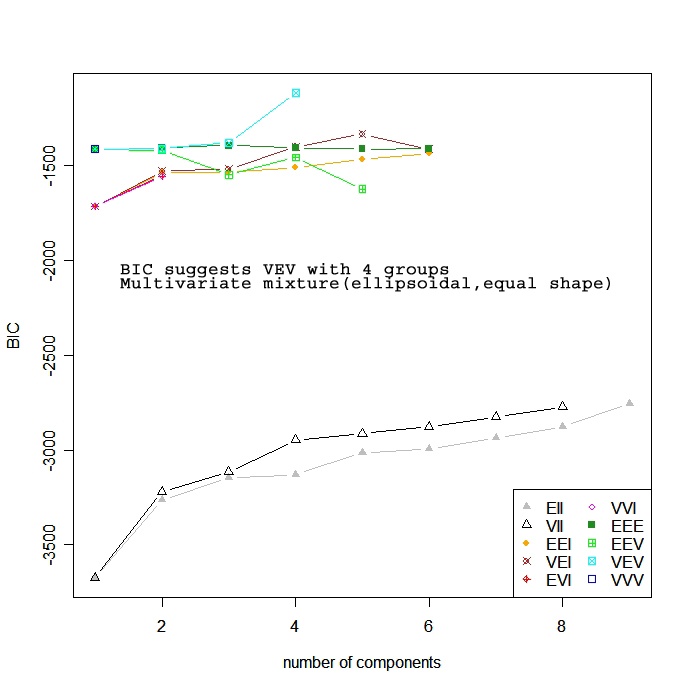
Model Based
Model based approaches assume a variety of data models and apply maximum likelihood estimation and Bayes criteria to identify the most likely model and number of clusters. Specifically, the Mclust( ) function in the mclust package selects the optimal model according to BIC for EM initialized by hierarchical clustering for parameterized Gaussian mixture models. (phew!). One chooses the model and number of clusters with the largest BIC. See help(mclustModelNames) to details on the model chosen as best.
# Model Based Clustering
library(mclust)
fit <- Mclust(mydata)
plot(fit) # plot results

summary(fit) # display the best model
 click to view
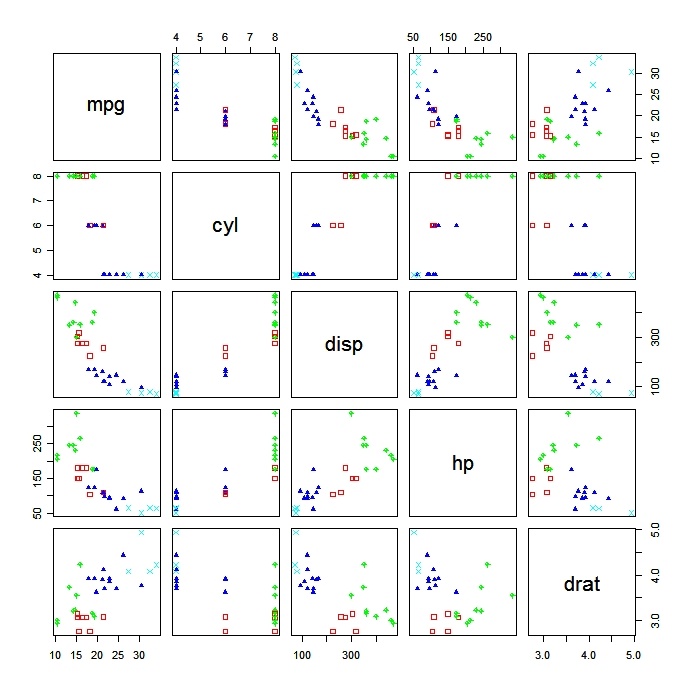
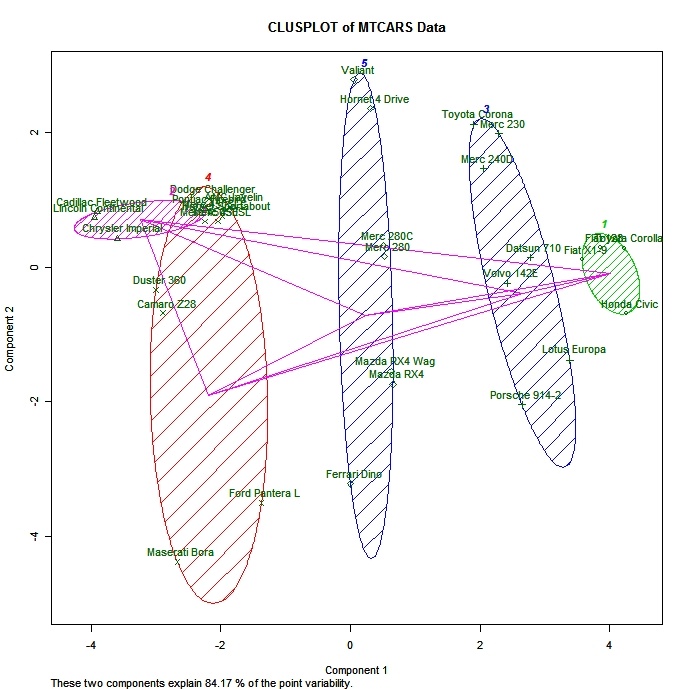
Plotting Cluster Solutions
It is always a good idea to look at the cluster results.
# K-Means Clustering with 5 clusters
fit <- kmeans(mydata, 5)
# Cluster Plot against 1st 2 principal components
# vary parameters for most readable graph
library(cluster)
clusplot(mydata, fit$cluster, color=TRUE, shade=TRUE,
labels=2, lines=0)
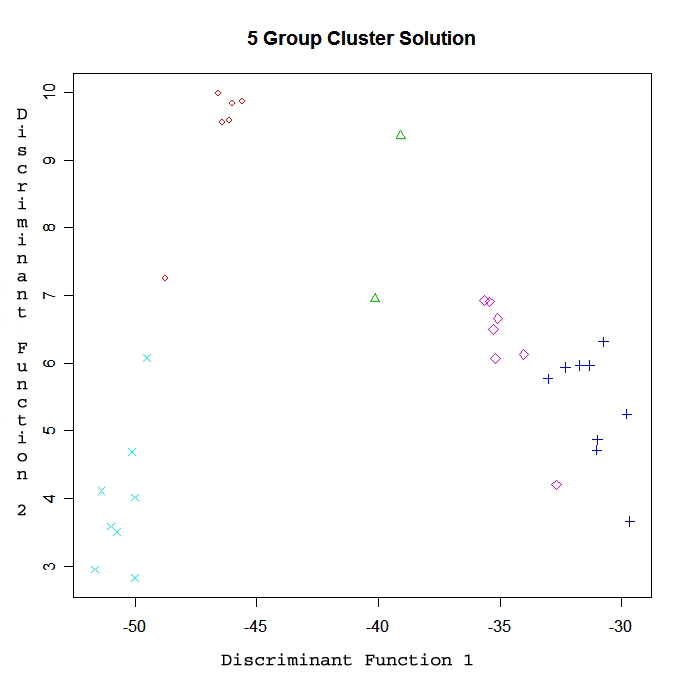
# Centroid Plot against 1st 2 discriminant functions
library(fpc)
plotcluster(mydata, fit$cluster)
 click to view
Validating cluster solutions
The function cluster.stats() in the fpc package provides a mechanism for comparing the similarity of two cluster solutions using a variety of validation criteria (Hubert's gamma coefficient, the Dunn index and the corrected rand index)
# comparing 2 cluster solutions
library(fpc)
cluster.stats(d, fit1$cluster, fit2$cluster)
where d is a distance matrix among objects, and fit1$cluster and fit$cluste r are integer vectors containing classification results from two different clusterings of the same data.
To Practice
Try the clustering exercise in this introduction to machine learning course.