Correlograms
Correlograms help us visualize the data in correlation matrices.
In R, correlograms are implimented through the corrgram(x, order = , panel=, lower.panel=, upper.panel=, text.panel=, diag.panel=) function in the corrgram package.
Options
x is a data frame with one observation per row.
order=TRUE will cause the variables to be ordered using principal component analysis of the correlation matrix.
panel = refers to the off-diagonal panels. You can use lower.panel= and upper.panel = to choose different options below and above the main diagonal respectively. text.panel= and diag.panel= refer to the main diagnonal. Allowable parameters are given below.
off diagonal panels
panel.pie (the filled portion of the pie indicates the magnitude of the correlation)
panel.shade (the depth of the shading indicates the magnitude of the correlation)
panel.ellipse (confidence ellipse and smoothed line)
panel.pts (scatterplot)
main diagonal panels
panel.minmax (min and max values of the variable)
panel.txt (variable name).
# First Correlogram Example
library(corrgram)
corrgram(mtcars, order=TRUE, lower.panel=panel.shade,
  upper.panel=panel.pie, text.panel=panel.txt,
  main="Car Milage Data in PC2/PC1 Order")
 click to view
# Second Correlogram Example
library(corrgram)
corrgram(mtcars, order=TRUE, lower.panel=panel.ellipse,
  upper.panel=panel.pts,
text.panel=panel.txt,
  diag.panel=panel.minmax,
  main="Car Mileage Data in PC2/PC1 Order")
 click to view
# Third Correlogram Example
library(corrgram)
corrgram(mtcars, order=NULL, lower.panel=panel.shade,
  upper.panel=NULL, text.panel=panel.txt,
  main="Car Milage Data (unsorted)")
 click to view
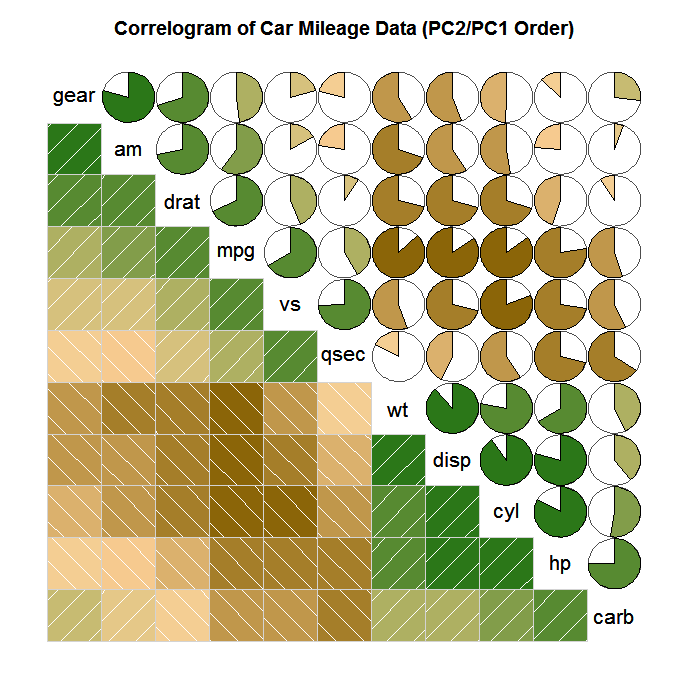
Changing the colors in a correlogram
You can control the colors in a correlogram by specifying 4 colors in the colorRampPalette( ) function within the col.corrgram( ) function. Here is an example.
# Changing Colors in a Correlogram
library(corrgram)
col.corrgram <- function(ncol){
  colorRampPalette(c("darkgoldenrod4", "burlywood1",
  "darkkhaki", "darkgreen"))(ncol)}
corrgram(mtcars, order=TRUE, lower.panel=panel.shade,
  upper.panel=panel.pie, text.panel=panel.txt,
  main="Correlogram of Car Mileage Data (PC2/PC1 Order)")
 click to view
Going Further
Take the Introduction to Statistics in R course to grow your statistical skills futher.