Interactive Graphics
There are a several ways to interact with R graphics in real time. Three methods are described below.
GGobi
GGobi is an open source visualization program for exploring high-dimensional data. It is freely available for MS Windows, Linux, and Mac platforms. It supports linked interactive scatterplots, barcharts, parallel coordinate plots and tours, with both brushing and identification. A good tutorial is included with the GGobi manual. You can download the software here.
Once GGobi is installed, you can use the ggobi( ) function in the package rggobi to run GGobi from within R . This gives you interactive graphics access to all of your R data! See An Introduction to RGGOBI.
# Interact with R data using GGobi
library(rggobi)
g <- ggobi(mydata)
 click to view
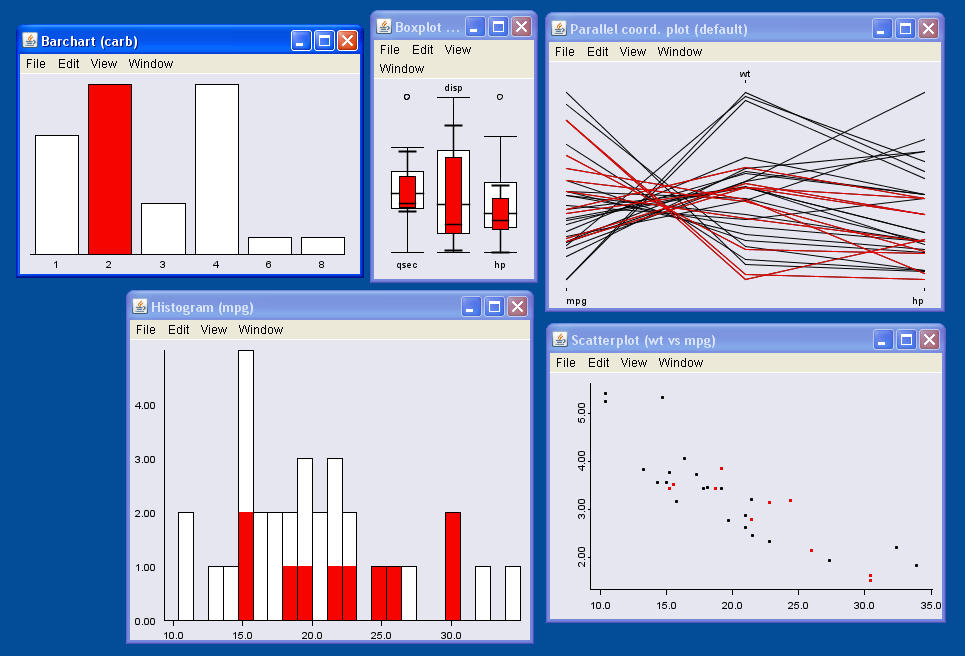
iPlots
The iplots package provide interactive mosaic plots, bar plots, box plots, parallel plots, scatter plots and histograms that can be linked and color brushed. iplots is implimented through the Java GUI for R. For more information, see the iplots website.
# Install iplots
install.packages("iplots",dep=TRUE)

# Create some linked plots
library(iplots)
cyl.f <- factor(mtcars$cyl)
gear.f <- factor(mtcars$factor)

attach(mtcars)

ihist(mpg) # histogram
ibar(carb) # barchart
iplot(mpg, wt) # scatter plot
ibox(mtcars[c("qsec","disp","hp")]) # boxplots
ipcp(mtcars[c("mpg","wt","hp")]) # parallel coordinates
imosaic(cyl.f,gear.f) # mosaic plot
On windows platforms, hold down the cntrl key and move the mouse over each graph to get identifying information from points, bars, etc.
 click to view
Interacting with Plots (Identifying Points)
R offers two functions for identifying points and coordinate locations in plots. With identify(), clicking the mouse over points in a graph will display the row number or (optionally) the rowname for the point. This continues until you select stop. With locator() you can add points or lines to the plot using the mouse. The function returns a list of the (x,y) coordinates. Again, this continues until you select stop.
# Interacting with a scatterplot
attach(mydata)
plot(x, y) # scatterplot
identify(x, y, labels=row.names(mydata)) # identify points
coords <- locator(type="l") # add lines
coords # display list
Other Interactive Graphs
See scatterplots for a description of rotating 3D scatterplots in R.
Other Visualization Programs
Explore building interactive plots with ggvis from RStudio in this course.