Dot Plots
Create dotplots with the dotchart(x, labels=) function, where x is a numeric vector and labels is a vector of labels for each point. You can add a groups= option to designate a factor specifying how the elements of x are grouped. If so, the option gcolor= controls the color of the groups label. cex controls the size of the labels.
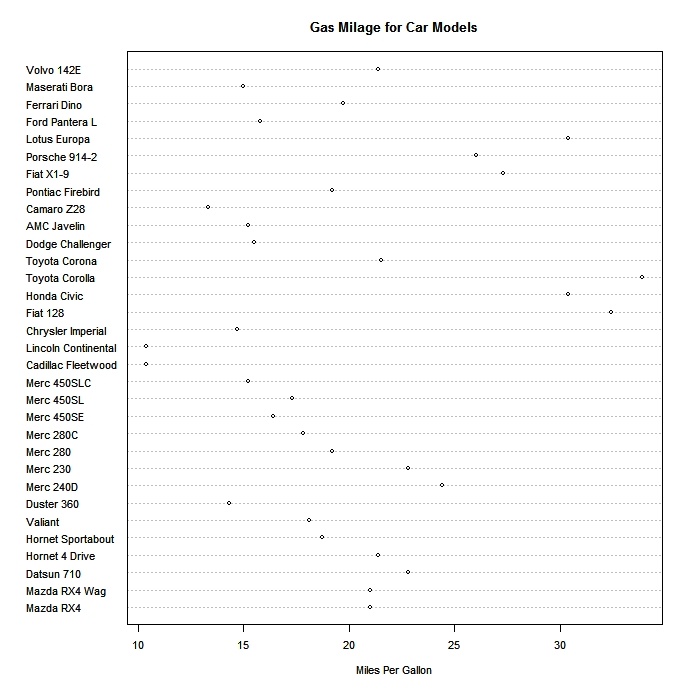
# Simple Dotplot
dotchart(mtcars$mpg,labels=row.names(mtcars),cex=.7,
   main="Gas Milage for Car Models",
   xlab="Miles Per Gallon")
 click to view
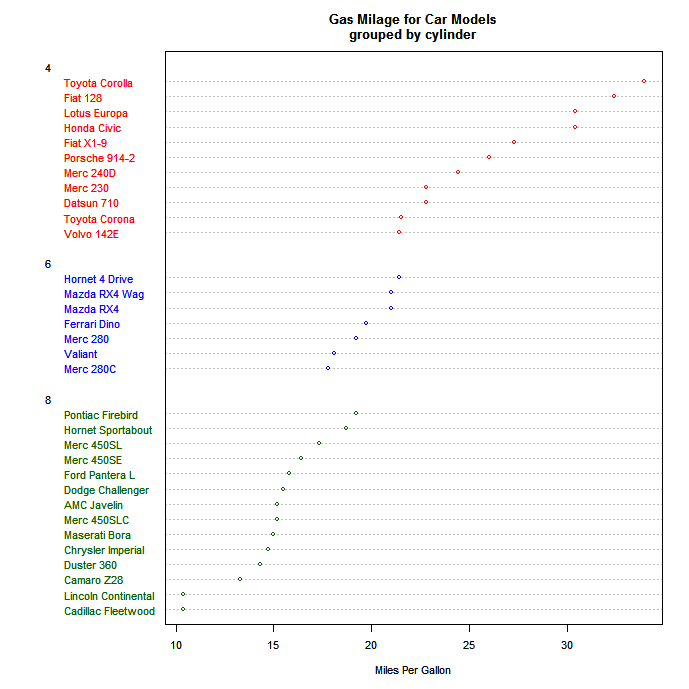
# Dotplot: Grouped Sorted and Colored
# Sort by mpg, group and color by cylinder

x <- mtcars[order(mtcars$mpg),] # sort by mpg
x$cyl <- factor(x$cyl) # it must be a factor
x$color[x$cyl==4] <- "red"
x$color[x$cyl==6] <- "blue"
x$color[x$cyl==8] <- "darkgreen"
dotchart(x$mpg,labels=row.names(x),cex=.7,groups= x$cyl,
   main="Gas Milage for Car Models\ngrouped by cylinder",
   xlab="Miles Per Gallon", gcolor="black", color=x$color)
 click to view
Going Further
Advanced dotplots can be created with the dotplot2( ) function in the Hmisc package and with the panel.dotplot( ) function in the lattice package.
To Practice
To practice making a dot plot in R, try this interactive exercise from a DataCamp course.