Creating a Graph
In R, graphs are typically created interactively.
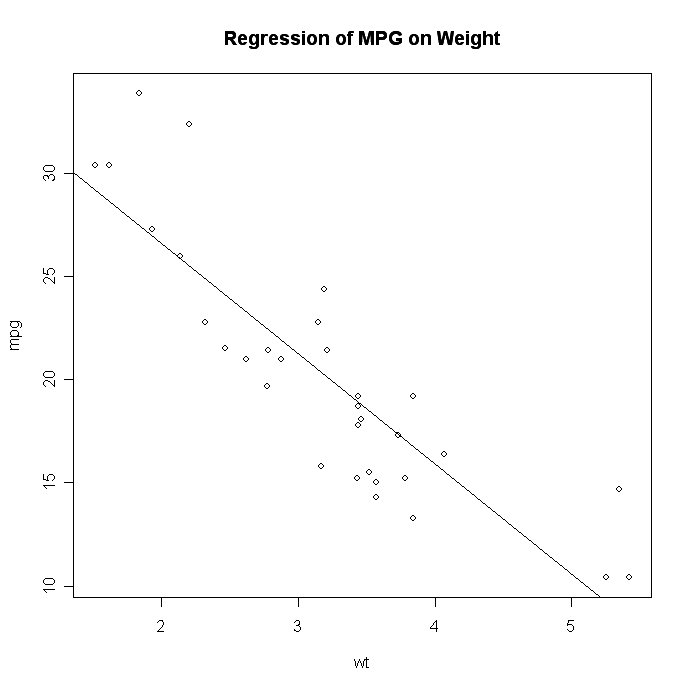
# Creating a Graph
attach(mtcars)
plot(wt, mpg)
abline(lm(mpg~wt))
title("Regression of MPG on Weight")
The plot( ) function opens a graph window and plots weight vs. miles per gallon.
The next line of code adds a regression line to this graph. The final line adds a title.
 click to view
Saving Graphs
You can save the graph in a variety of formats from the menu
File -> Save As.
You can also save the graph via code using one of the following functions.
| Function | Output to |
| pdf("mygraph.pdf") | pdf file |
| win.metafile("mygraph.wmf") | windows metafile |
| png("mygraph.png") | png file |
| jpeg("mygraph.jpg") | jpeg file |
| bmp("mygraph.bmp") | bmp file |
| postscript("mygraph.ps") | postscript file |
See input/output for details.
Viewing Several Graphs
Creating a new graph by issuing a high level plotting command (plot, hist, boxplot, etc.) will typically overwrite a previous graph. To avoid this, open a new graph window before creating a new graph. To open a new graph window use one of the functions below.
| Function | Platform |
| windows() | Windows |
| X11() | Unix |
| quartz() | Mac |
You can have multiple graph windows open at one time. See help(dev.cur) for more details.
Alternatively, after opening the first graph window, choose History -> Recording from the graph window menu. Then you can use Previous and Next to step through the graphs you have created.
Graphical Parameters
You can specify fonts, colors, line styles, axes, reference lines, etc. by specifying graphical parameters. This allows a wide degree of customization. Graphical parameters, are covered in the Advanced Graphs section. The Advanced Graphs section also includes a more detailed coverage of axis and textcustomization.
To Practice
Try the creating graph exercises in this course on data visualization in R.